Getting Started
FlexIt Analytics is a business intelligence and analytics solution built for everyone in your organization. Intuitive design enables business people to create analyses without training. Powerful integrations and advanced features enable the most advanced users to do what they need. No matter who you are, FlexIt works for you.
This guide assumes that FlexIt has already been deployed and configured.
Logging In
When you are given access to FlexIt, you should receive details regarding log in. If you do not have an account, you can go to the FlexIt login page and click Request Account at the bottom. If you have an account, you may also be able to reset by clicking Forgot Password? at the bottom.
Welcome Page (Home)
When you first log in, you'll be taken to the FlexIt home page. Your role(s) will determine what you see since different roles have access to different content (reports, dashboards, folders).
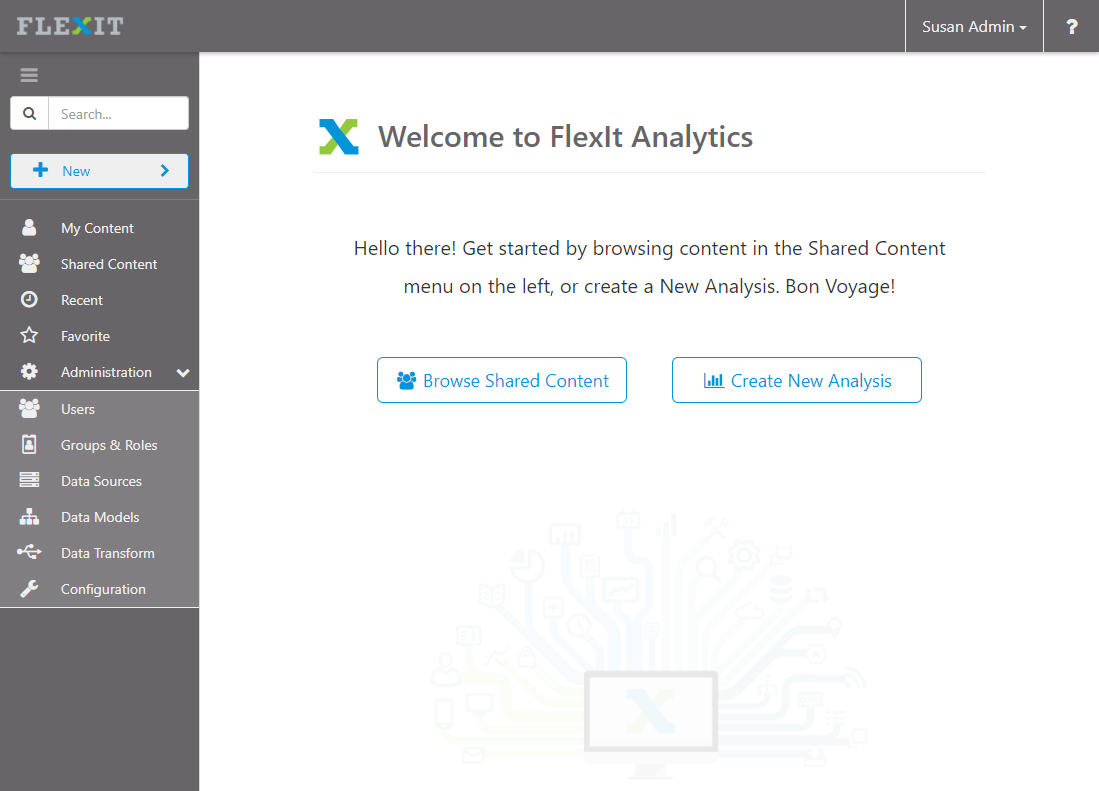
Accessing Content
The menu on the left will be for creating and running reports and dashboards.
- My Content - contains personal items that only you have access to.
- Shared Content - contains shared items that are publicly accessible. Depending on your group/role, you may not see all folders. See the Administration Guide for more details on securing content.
- Recent - shows the last 10 items that you ran with date
- Favorite - shows items that you have marked as favorite by clicking on the fav star on reports or dashboards
Search - use the search box to quickly locate reports, dashboards, or folders
Creating Content
You must be in the Author role to create content. As an author, you'll see New Analysis and New Dashboard in the left-menu at the top. Dashboards rely on analyses, so make sure that you have underlying analyses created to use in your dashboards.
When you click New Analysis, you will see a list of Data Models. Data models are business views that organize your data and allow you to drag-and-drop columns/fields in to a report without needing to know SQL, aggregation techniques, and more complex functions. Select the data model that you would like to create an analysis on. Now you are in the report design mode. As you create new analyses and dashboards, you'll notice tabs are created in the top header, allowing you to have many items open at once.
Now let's go ahead and create our First Analysis!
Administration
If you are assigned to the Admin role, then you will see the Administration menu at the bottom-left.
Read the full guide: Administration
My Account
In the top-right, you will see your username. Click the drop-down for access to:
- My Account - shows your account details. E.g. username, email, groups/roles
- Sign Out - log out of FlexIt
Help
For help, click the question mark in the top-right for access to:
- Documentation - user guides and other documentation
- About - details about FlexIt, such as version
My First Analysis
For this exercise, we'll use the Samples model. If you don't have access to this model, use another model or have an administrator deploy the Samples model.
OK, let's get started:
- Click on the
 button in the portal and select New Analysis.
 - Select the Samples data model
- From Fields in the right panel, add Country, Host Year, and Gold Medals by double-clicking, drag-and-drop, or search
- Try different visualizations in the Visualizations panel on the right
- Now say "wow, that was easy!". Save your report, or keep making it great...
Check out the Reporting User Guide to learn everything about creating analyses
My First Dashboard
For this exercise, we'll use the Samples reports. If you don't have access to this, use other reports or have an administrator deploy the Samples.
OK, let's get started:
- Click on the button in the portal and select New Dashboard.
- Select the 3rd template with 2 top panels and 1 bottom panel
- Click the plus button in the top-left panel to add a visualization. Find and add the Area Chart (100% Stacked) report.
- Repeat the step above, adding Scatter Plot (with regression) to the top-right panel and Sankey Chart to the bottom panel
- That's it! Save your dashboard, or keep making it great...
Check out the Dashboarding User Guide to learn everything about creating dashboards
That's All, Folks!
Now you have a pretty good handle on how things work in FlexIt. Check out our more in-depth guides.
Administration Guide for tasks like managing users, data sources and models, server configuration, and more
Data Models Guide for creating business views
Enjoy!