Reporting User Guide
New Analysis
To create a new report, click on the  button in the portal and select New Analysis. You'll see a list of Data Models that you have permission to (contact your admin if your data model is not shown). Some users may see the Upload Excel/CSV button or the New SQL Analysis button, which allows you to write custom SQL to pull report data.
Note: the Consumer role does not have access to create new reports, and thus will not see the New Analysis or New SQL Analysis buttons. Check your role from My Account.
One you've selected a data model, you'll be taken to the Report design page.
Report Design (ad-hoc)
When starting a new report, you'll add fields from the right pane and add filters from the top pane. New reports start in "ad-hoc" mode, meaning that live data is retrieved as you add new fields and filters. You can exit "ad-hoc" mode by clicking the Builder Page option from the menu in the top-right of the report.
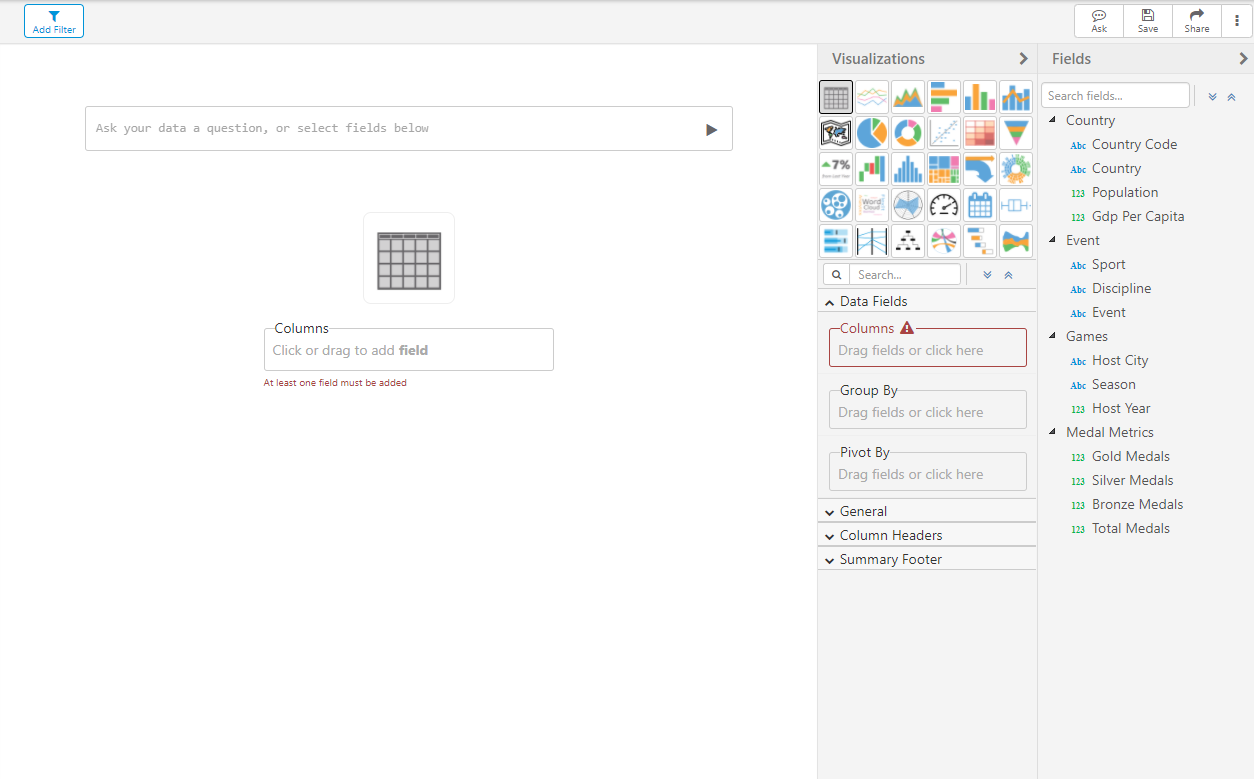
Add Fields
From the Fields menu on the right, you can add fields by dragging, double-clicking, or right-clicking. As you bring fields into the working area, data will be displayed in a grid/table. You can visualize (chart) your data by simply clicking any of the charts in the Visualizations panel on the right.
You can drag fields into Data Fields in the Visualizations panel, shown below:
Filters - if you're working with large amounts of data, or want to narrow your results, add report filters before adding fields
Filters
Add filters to narrow your search and focus your data exploration. They also improve performance on large data sets. The  button is a quick way to search all your fields and apply a filter to a selected field, regardless of whether or not the field is displayed on in the report grid and/or visualization. Filters can be applied to fields with data types of text/string, numeric, or date/time. Depending on the data type, the filter will have different options. All filter types allow you to check Include null if you would like to keep null database values in the result.
Filter data types
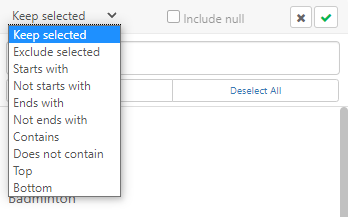
Text/string
The text/string filter will allow you to include/exclude selected items or filter items that start with, end with, or contain certain text. You can also filter a chosen number of items in the top or bottom of a specific measure (e.g. Top 10 Country by Gold Medals).
Numeric
The numeric filter will allow you to include/exclude values in a certain range (leaving to/from blank sets the range to min/max).

Filter Detail Values - by default, numeric filters are applied to the summary values. Check Apply filter to detail values? in order to filter by individual rows.
Date/time
The date filter allows you to include/exclude a range of dates, or filter a specified number of days/weeks/months/years from the current date.

Filter Configuration
You can access more advanced filtering features from the Builder Page.
To configure individual filters, hover over a filter and click the Configuration button (labeled 1 below). For report-level filter configuration, click the Configuration button in the top-right of the filter panel (labeled 2 below).

Individual filter configuration allows you to modify the following attributes:
- Label - the text that displays next to the filter
- Description - text or html that appears when you hover over the info icon next to a filter
- Use Value - if you want to use a different value than is displayed. e.g. filter on Country Code, but display Country Title
- Display Value - display a different value than is used for the filter
- Multiple - for dropdown lists, allow a single selection or multiple
- UI Type - dropdown shows a list of values, manual allows you to enter free-form text, checkbox shows values in a checkbox or radio button, expression allows you to enter an expression (e.g. Year = year(current_date)).
- Required - is a filter selection required to run the report
- Locked - can the filter be removed from the report
- No Cascade - is the list of values dependent on other report filters
- Defaults - default values to show on the report
- Sort - for dropdown lists, display values in ascending or descending order
- Sort By - sort display values by another field
- Hide - do not show the filter on reports. The filter is still applied.
- Prefilters - apply a filter to the filter so only select values are shown.
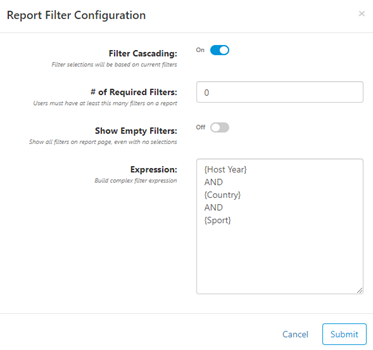
Report-level filter configuration allows you to modify the following attributes:
- Filter Cascading - filter values in dropdown will be based on all other report filters. For example, if a report on olympics data has a filter for Country=USA, then a new filter for Athlete will only show values for USA. If an individual filter has No Cascade enabled, then filter cascading will not apply for that filter.
- Number of Required Filters - users must have at least this many filters on a report. This is typically used to prevent users from accidentally running reports with no filters, often on larger data sets.
- Show Empty Filters - always show filters on report page, even if the filter has no selections
- Expression - allows for building of complex filter expression
Filter Group
From the Builder Page, when you click on the Add Filter button, you'll see an option for Add Filter Group..., as shown here:
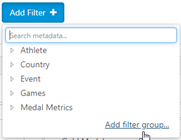
This feature allows you to create a prompt where each item is a filter. For example, instead of having a user select a date range, you could create a filter group with three individual filters for Past month, Past 6 months, and Past 12 months. This makes it quicker/easier for the user, but also makes it so they can't accidentally select the wrong dates. Here's what the resulting filter will look like to the user:

Grid
The data grid/table is like a spreadsheet in your browser and is a great way to explore your data before you chart/visualize. Similar to Excel, you can pivot, group, sort, filter, aggregate (i.e. sum, avg, count, etc.), calculate, and much more.
Group
Grouping allows you to organize data in sets that can be aggregated and expanded/collapsed for quickly exploring your data. Grouping is typically done on string/text or date types, but numbers can also be grouped if they're configured as dimensions that do not aggregate.
To group, click or right-click on the column/field or column header and select Group, as shown below. You can un-group a column by clicking or right-clicking and selecting Remove Group.
Pivot
Pivoting a field displays the values at the top, from left to right as columns. To pivot, click or right-click on the column/field or column header and select Pivot, as shown below. You can remove the pivot by clicking or right-clicking and selecting Remove Pivot.
Sort
You can sort a field/column a few different ways:
- Click the column header, once for ascending, again for descending, and once more to remove the sort
- Right-click the column or column header and select Sort Ascending/Descending/None
- You can sort by another field that is not displayed on the report. Simply right-click the column, select More Settings..., and select a field from Sort by Other Field.
Aggregate
All columns can be aggregated by simply right-clicking the column, going to Aggregate and then selecting the type of aggregation that you would like to do (i.e. sum, avg, count, etc.). Numbers/measures and text/dimensions will allow different types of aggregation.
If columns are grouped, then aggregated columns will show summaries at each grouping level as well as the bottom of the report (hide the total footer from Grid Configuration). If you'd like to to complex aggregations and/or change aggregation types at different grouping levels, then you can select Advanced... as the aggregate type from the context-menu or Field Configuration
The example below shows how to do an Advanced Aggregation and set different aggregation types at grouping levels. It counts distinct Athlete Names and gives a sum for totals (you can rename the column by setting the label in Field Configuration):
Calculations
Create a new calculation by right-clicking a column and selecting Calculate.
Math - allow you to do math functions (add, subtract, multiply, divide, etc.). You can perform math functions on any column in the data model, report, or also a number that you manually enter. Click the Add Item button to add new field items, or the Add Operation button to add math functions, then drag them around to create the expression.
Text - allow you to apply character-based functions, such as substring(), left(), right(), and replace().
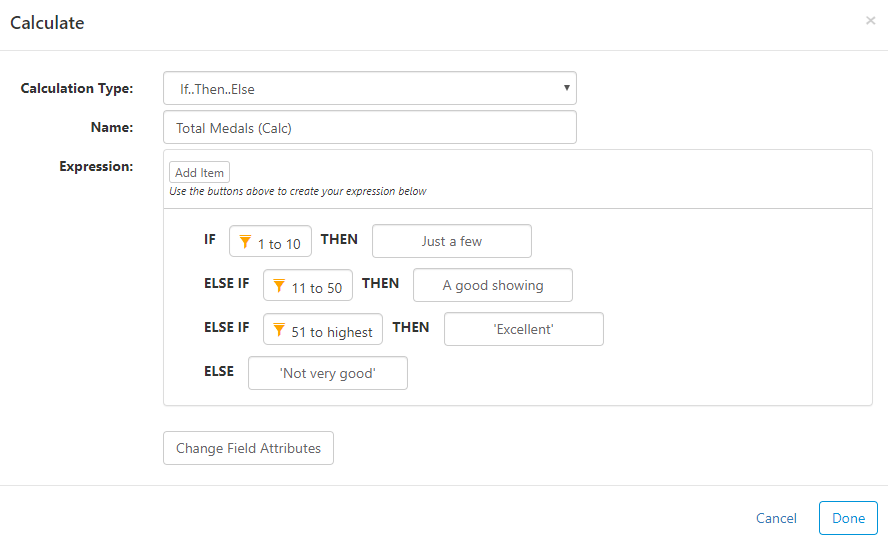
If..then..else (Case Statement) - allow you to use complex logic to define calculated results, as shown below.
Drills
When you click on a number/measure on the grid, it will automatically show you any existing drills and also allow you to add a new drill. To add a new drill, click New Drill and search for the report you'd like to drill to, as shown below.
You can also drill down or across on any text/dimension field. The example below shows a drill on Country down to Athlete Name. This action adds a filter for Country = 'United States' and replaces the Country column with Athlete Name, as shown here:
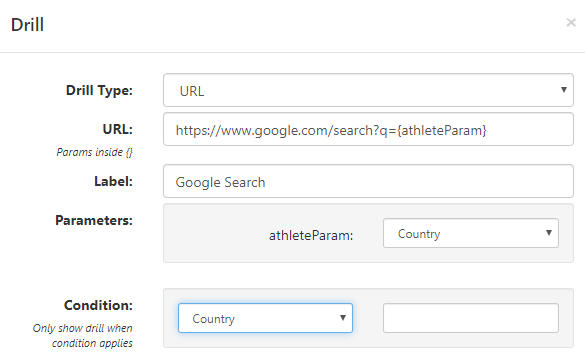
You can also drill to external websites and pass columns from the report to the URL parameters. To pass a column from the report, put it in the URL inside of {} curley braces. You can also set a condition to only allow the drill when certain criteria are met. For example, you could create a drill on Athlete Name that opens a Google Search, as shown below.
Edit Column Drills - Drills for a column can always be edited from Field Configuration.
Conditional Formatting
Conditional formatting allows you to display cell contents different ways depending on the rules that you set. From Field Configuration, you can add rules next to Conditional Formatting, as shown below. Conditional style formatting can be applied to:
- Text - change the text color
- Background - change the cell background color
- Entire Row - change the background color of the entire row
- In-cell Visualization - if an in-cell visualization (e.g. Row Chart sparkline) is selected, you can change the style of the visualization
- Icon - select from nearly 500 icons to display in the cell, then give it some style
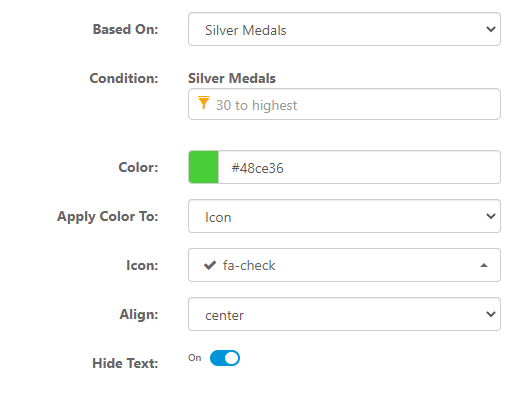
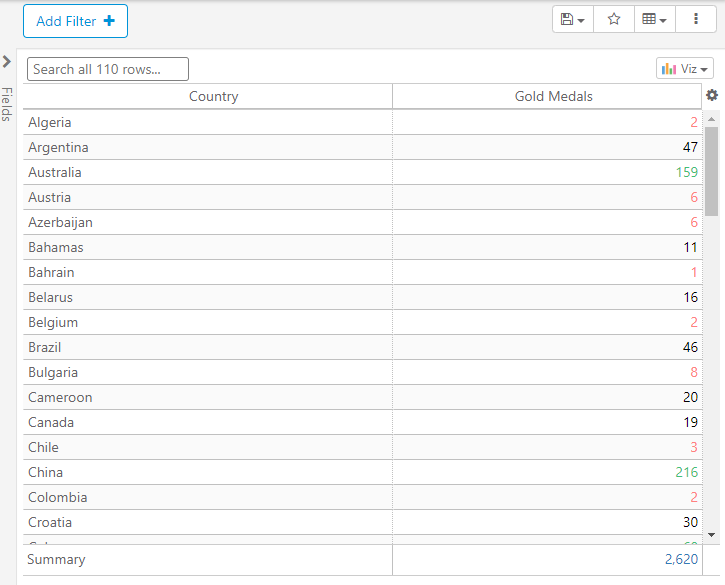
Each row of data on the report will be tested to see if any of the rules apply. If a rule applies, then that cell or row is formatted based on the rule, as shown below.
Field Configuration
All options for a column can be found and modified by right-clicking a column and selecting More Settings....
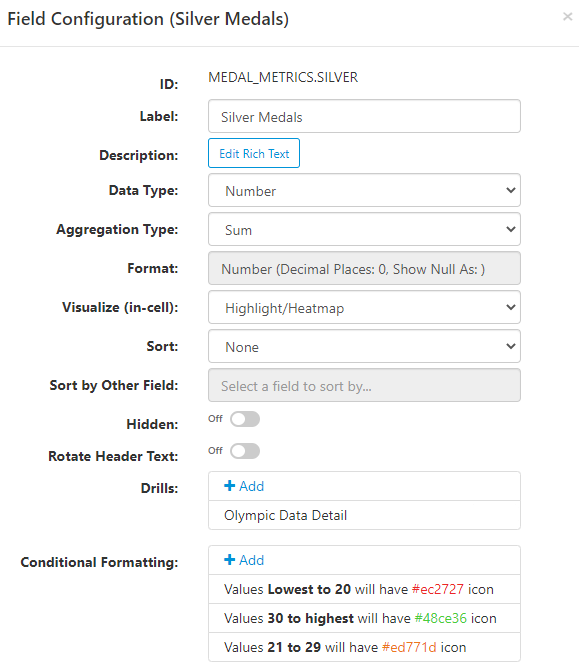
- ID - the unique identifier for the field (not editable)
- Label - the text title for the field
- Description - a text/html description that shows detailed information about fields in a tooltip.
- Data Type - should the field be treated as a String (text), Number, or Date. Numbers can be treated as text, text as numbers, and so on
- Aggregation Type - type of aggregate, if any
- Format - formats for number, date, percent, currency, and text
- Visualize (in-cell) - display Hightlight Table (Heatmap) or sparkline Bar Chart in grid cells base on metric
- Sort - ascending, descending, or none
- Sort by Other Field - sort this column by another field that is not displayed on the report
- Hidden - keep the field on the report, but hide it from view
- Rotate Header Text - rotate the column header to display vertically
- Drills - create or edit drills
- Conditional Formatting - manage conditional formatting for the column
Re-order columns
Move grid columns around by dragging the column header to the desired position. You can also re-order columns from the Builder Page.
Export to Excel/CSV
You can export to Excel and CSV from the Grid Configuration button menu at the top-right of the grid.
Copy to clipboard - Drag/select the cells you want and using your keyboard copy/paste commands.
Grid Configuration
To access grid settings, click the  button at the top-right of the grid.
- Export to Excel - download the data into .XLSX format
- Export to CSV - download the data into comma separated .CSV format
- Advanced Export - specify inclusion of column headings, groups, and totals in download to Excel or CSV
- Fit Columns - set column widths to fit the length of text in each column
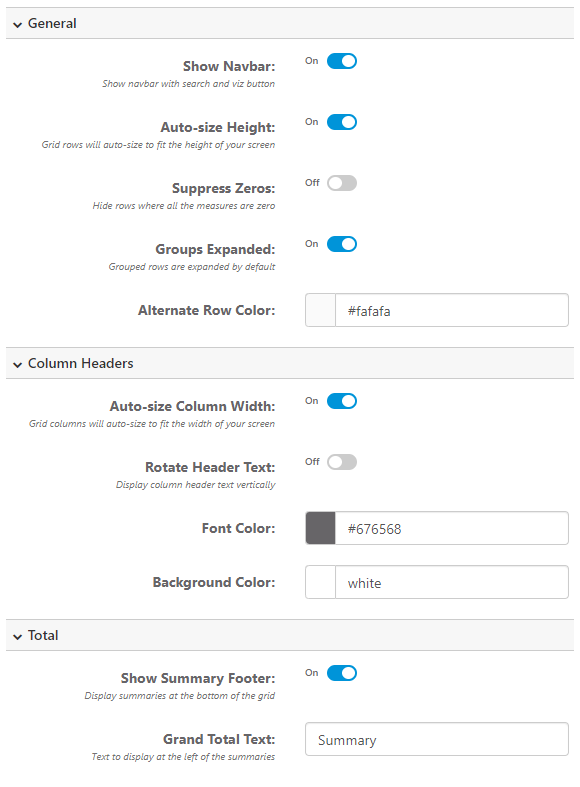
- More Settings - access more grid configuration properties, as shown below
Charts (Visualization)
Once you're done exploring your data and are ready to explain your data, choose one of the many vizzes in the Visualization Panel. Each viz has it's own Data Fields and configuration options that can be changed below. See the Visualization Guide for in-depth details about the different vizzes.
Report Options
Report Menu
The report menu is located in the top-right of the report and is used for the following:
- Save/Save As - save your report, or make a copy with Save As
- Share - share your report as PDF, Excel, CSV, or as a URL link that can also be embedded. (See Sharing)
- Chart & Grid - toggle to show visualization, data grid table, or both
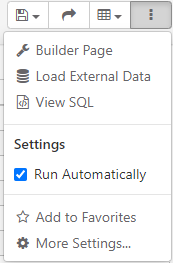
- More Options
- Builder Page - brings you to the Builder Page, allowing you to work on the report with no data (i.e. not ad-hoc/live data)
- Load External Data - join with external data from a CSV file, similar to a VLOOKUP in Excel
- View SQL - view the SQL that the report generates (certain roles do not see this)
- Edit SQL - if the report is from a SQL Analysis, this is where you edit the SQL statement
- Run Automatically - uncheck this box in order to always display the Builder Page when the report is ran
- Add to Favorites - add report to your personal favorites
- More Settings - change report configuration properties, shown below
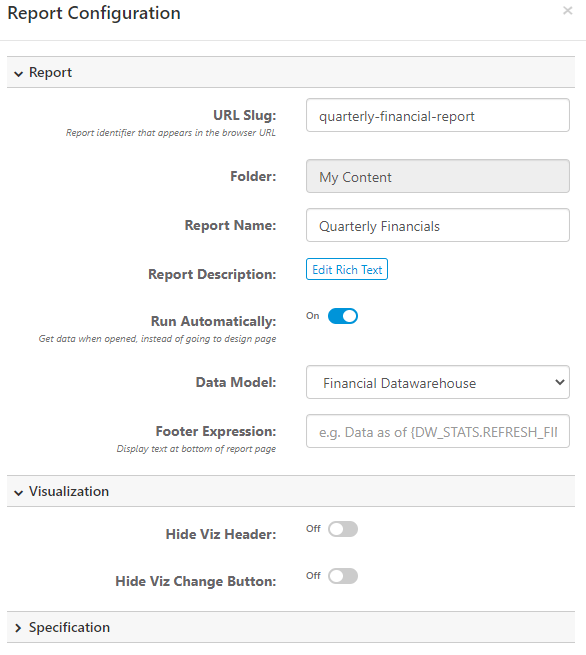
Report Backup/Migration - copy/paste from the report Specification to save as a backup or open report from specs
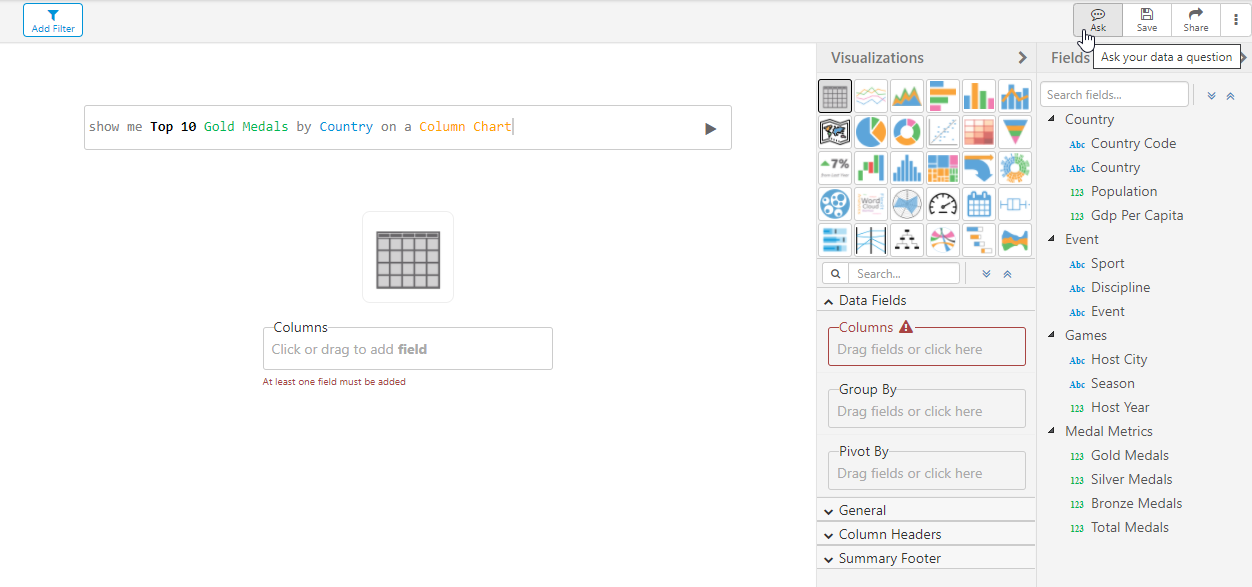
Natural Language Query
Natural language query allows you to use text to generate a report by asking a question, similar to a Google search. For example, show me Top 10 Gold Medals by Country on a Column Chart will get you a Column Chart with the Gold Medals metric and the top 10 Country dimension. On a new report, just enter text in the search input in the middle of the page. On an existing report, click the Ask button in the top-right.
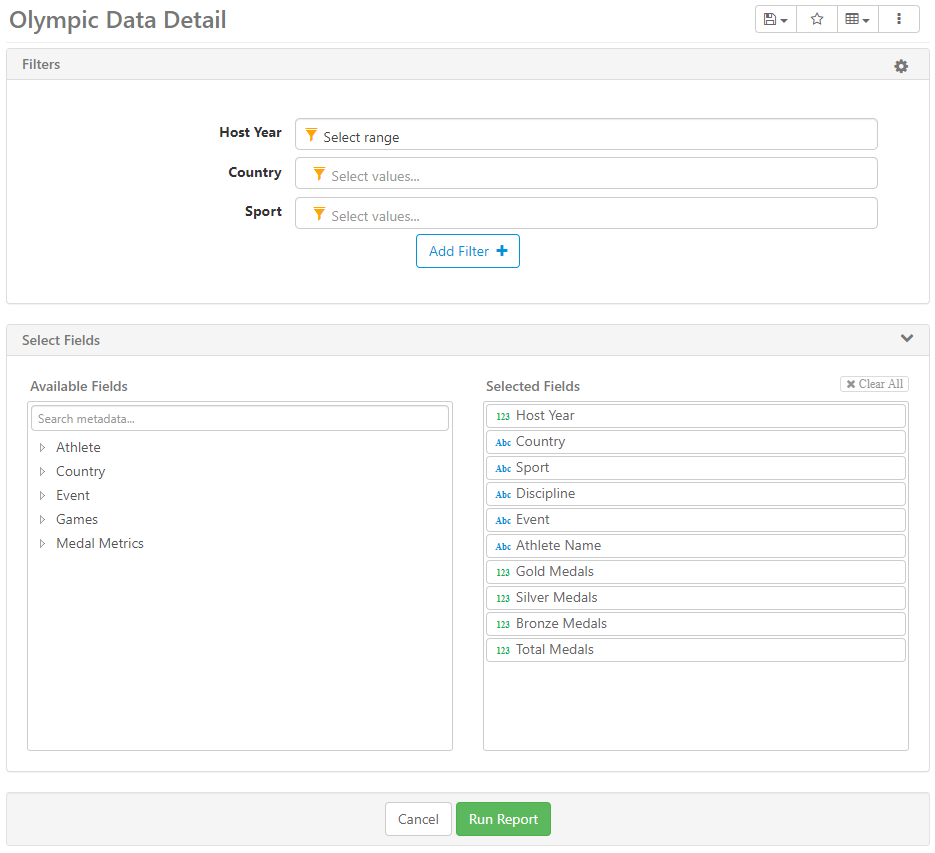
Builder Page
The Builder Page allows you to create your report without live (ad-hoc) data. You can add fields, prompts/filters, pivots, etc. When you're done building, you can click Run Report and start working with the data.
To always open to the builder page, go to report settings and uncheck Run Automatically
Prompts
Prompts are filters displayed on the Builder Page that allow users to narrow the data results before the report is run. For example, a car sales report might prompt the user to select Year, Make, and Car Model. This helps users focus their data results, but also ensures that reports run faster by querying less data. Prompts can be added to the Builder Page with no selections made, or they can also have some default selections.
For more detailed information, check the Filters section above.
Field Selection
The builder page can be a much quicker way to create reports if you know how to use it. Quickly add fields, order them, and set grouping, pivoting, and more from here. Use the Metadata search to quickly search and add your fields, shown here:
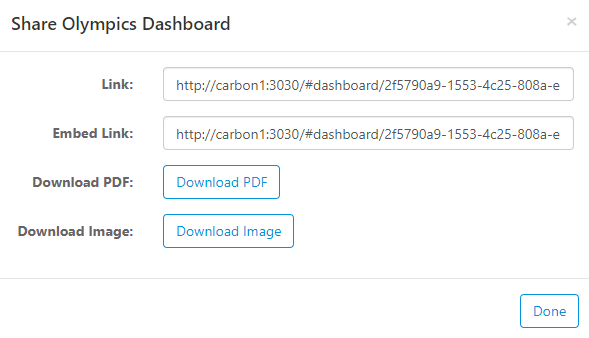
Share (PDF, Image, Link) or Embed
The toolbar Share button allows reports to be shared as a link, .pdf, or .png image. They can also be embedded in other sites using the Embed link.
Schedule Delivery
You can schedule email delivery of reports from the FlexIt Portal by following these steps:
- Find the report or dashboard in the FlexIt Portal folders
- Click the ellipsis on the right of the report, or right-click the report
- Select Schedule
- Enter the schedule (daily/weekly/monthly), who to deliver it to, and what file formats to deliver
- Click Save and the schedule is set
SQL Report
Depending on your role, you may be able to create an analysis based on custom SQL. When you create a new report, instead of selecting a Data Model, select New SQL Analysis and it takes you to this screen:
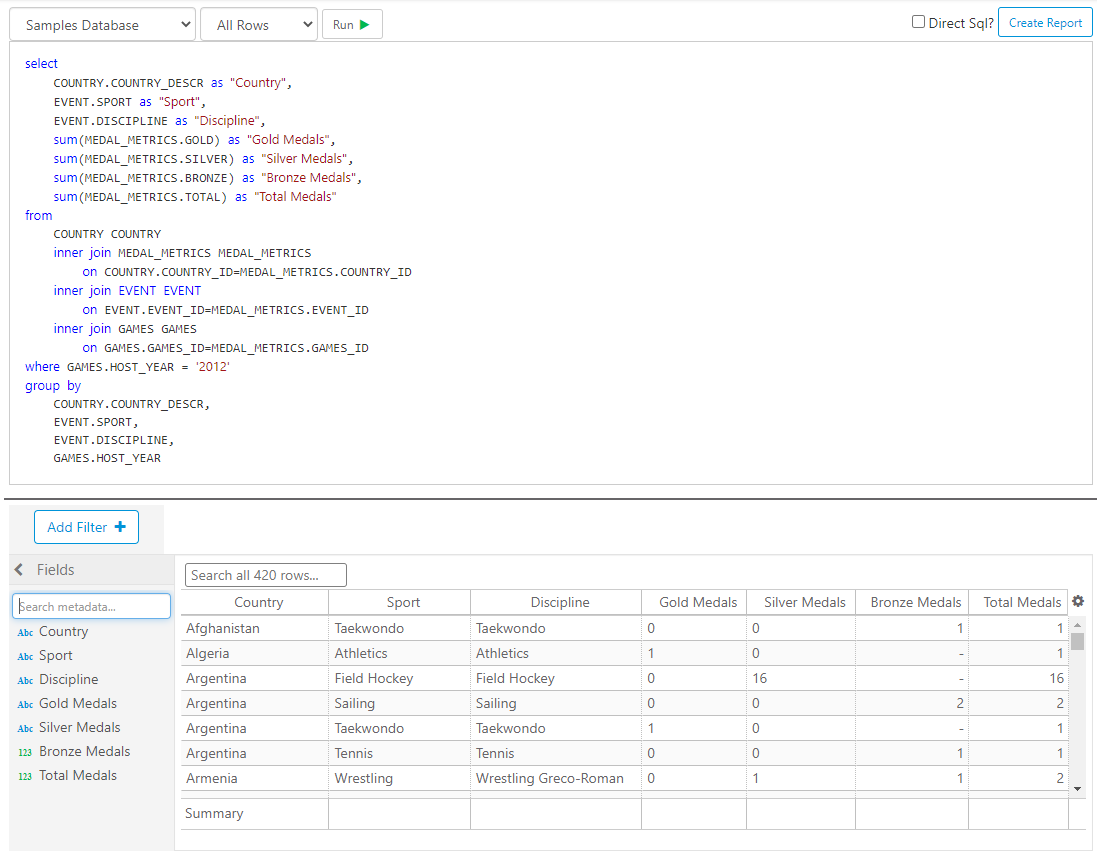
Build and test your SQL, then click Create Report in the top right. If you need to edit your SQL in the future, you can do so from the Report Menu.
Direct SQL - the Direct SQL option in the top-right will execute SQL exactly as it appears. This could cause performance issues on large datasets and is not recommended unless it is necessary.
Upload Excel/CSV
Depending on your role, you may be able to create an analysis from an Excel, CSV, or Tab delimited spreadsheet. When you create a new report, instead of selecting a Data Model, select Upload Excel/CSV at the top
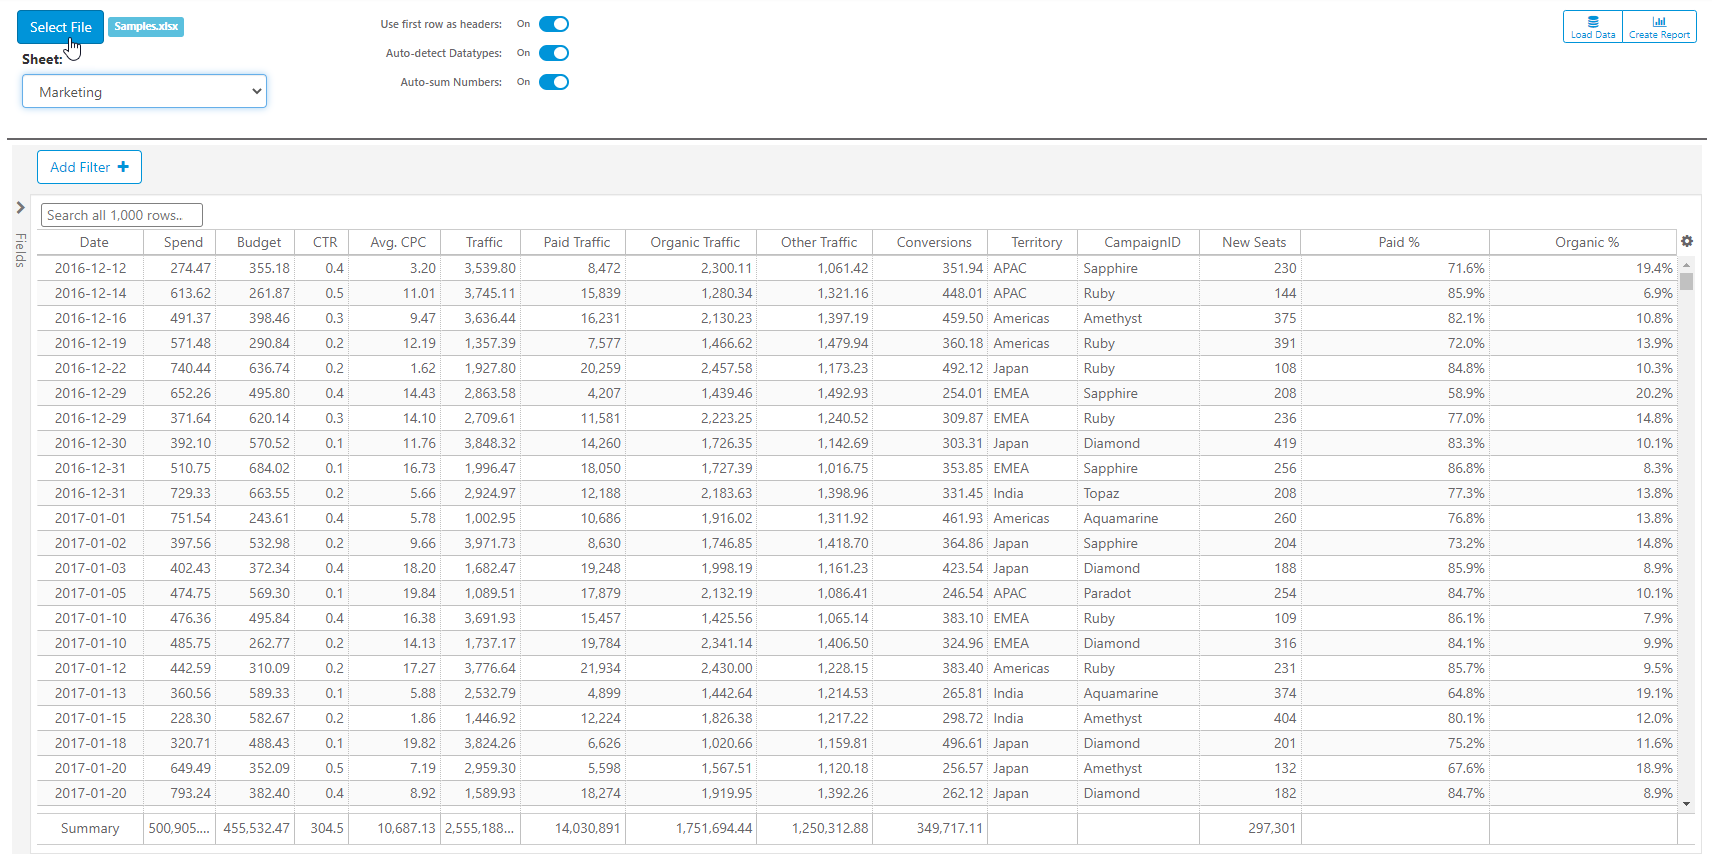
Set the options for parsing the spreadsheet:
- Use first row as headers - this will make the column names based on the first row in the spreadsheet, and the data starts on row 2
- Auto-detect Datatypes - automatically detect data types numeric, date, text, as well as formatting (e.g. number of decimals)
- Auto-sum Numbers - automatically aggregate numeric columns
Select a file in the top-left, then a sheet if you're using Excel. The data will load automatically so that you can manipulate the data in the grid below. Once you are satisfied with the data in the grid, you can either Load Data into a database or Create Report on the fly.
Load Data
When loading data into a database, you will take three steps:
Create Report
Instantly analyze your data. Please note that you cannot save this report unless you load the data, as shown above.
Pass Filter in URL
You can filter a report using query string parameters in the URL. The required URL format uses the specs parameter and JSON format to allow for simple and advanced filter structures. You can pass any type of filter that can be built in FlexIt. To see the format used, build a report with the desired filter, then go to Report Options and select More Settings. From there, expand the Report Specifications and look for the filters JSON object, which will be the exact structure you can use. Here is an example that also shows how to change report name and uiaction (run or prompt):