Orchestration (Pipelines)
Available in 2026.06.001 and later. Older installs only have Data Transforms and their schedules — pipelines, the Orchestration sidebar entry, the Run History / DAG / Overview tabs, and pipeline-aware parameter propagation all require this release or newer. See the release notes for the full set of orchestration features added in 2026.06.001.
Overview
Orchestration lets you chain together Data Transforms, dbt jobs, and Analyses into a single ordered pipeline. Where a Data Transform's Container runs tasks in parallel, a pipeline runs steps in sequence, passes parameter values between them, gates downstream work on upstream success or failure, and writes a single run history that ties everything together.
Typical pipeline shapes:
- A nightly refresh: import data → run dbt → run data quality tests → email a digest analysis.
- A monthly close: a sequence of Data Transforms that each must finish before the next begins, with the final step kicking off a report.
- An incremental load with snapshot: extract from source → load to staging → run dbt models that snapshot into a uniquely-named schema per run.
Getting Started
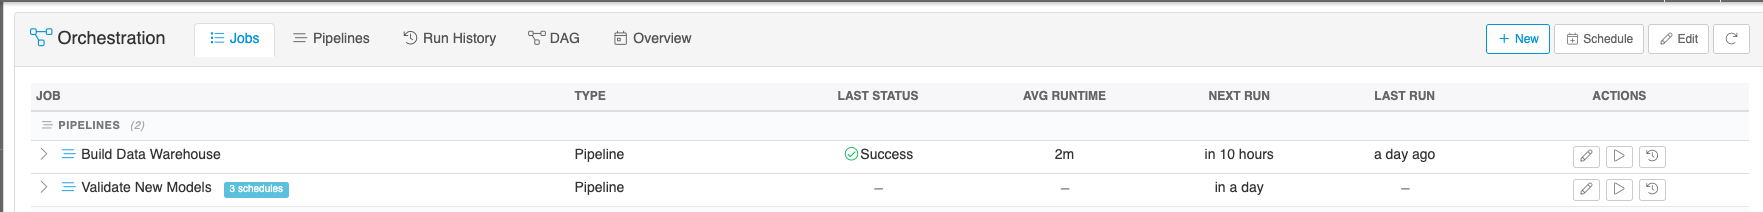
Open Orchestration from the left sidebar. The page is organized into tabs:
- Jobs — list of Data Transforms (the building blocks pipelines run)
- Pipelines — list of pipelines
- Run History — every pipeline + job run across the system, filterable
- DAG — visual dependency view of jobs and pipelines
- Overview — calendar of scheduled and recent runs
Switch to the Pipelines tab and click + New to create one, or click an existing pipeline to edit. Each step in a pipeline references an existing Data Transform, dbt job, or Analysis — pipelines orchestrate work; they don't redefine it.
To trigger a run, click the Run action on a pipeline. The Run Status modal opens automatically and updates live. Closing the modal doesn't stop the run; you can reopen it from the Run History tab.
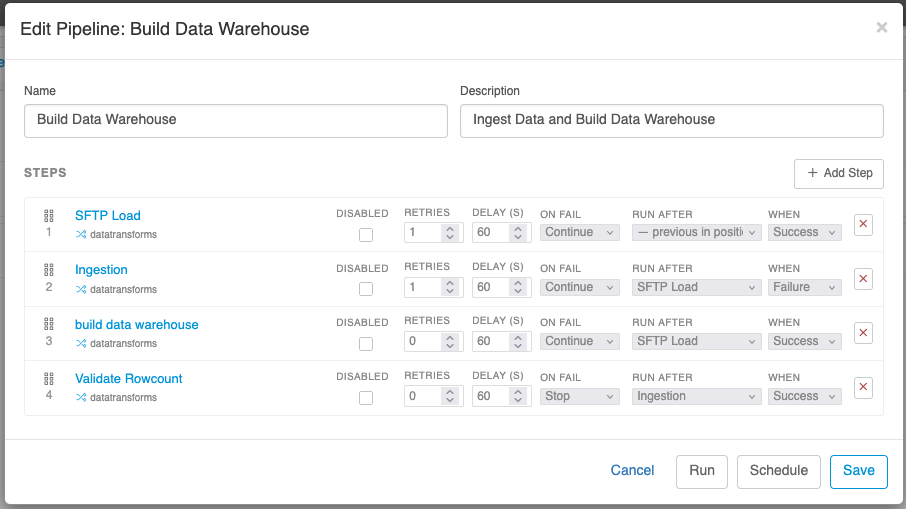
Steps
A pipeline is an ordered list of steps. Each step has:
- A type that determines what kind of work it runs
- A display name (defaults to the underlying item's name; auto-syncs if you rename the source)
- Optional When, On Failure, and Disabled flags
Steps execute strictly in order. Step N does not start until step N-1 has reached a terminal state (success, failure, or skipped). There is no implicit parallelism between pipeline steps — for parallel work within a single transform, use a Container.
Step Types
- Data Transform — runs an existing Data Transform exactly as it would run on its own. Parameters declared on the transform participate in pipeline-wide propagation (see Parameters).
- dbt Job — runs a dbt Cloud or dbt-core job. The
command_invocation_id(dbt-core) or job run id (dbt Cloud) is captured and made available to downstream steps as an automatic parameter. - Analysis (contentitems) — renders a saved Analysis as part of the pipeline. Usually used at the end of a pipeline to materialize a "view of this run's results" via the Run Status modal's drill-through. Analyses with
[[@name]]placeholders in their SQL receive the pipeline's accumulated parameter values automatically.
Step Properties
Right-click any step (or open its properties drawer) to set:
- Disabled — when on, the step is skipped at run time and recorded as
disabledin the run history. The pipeline continues as if the step succeeded with no output. Use this during development to temporarily bypass a slow or destructive step without removing it from the design. - When — controls whether the step runs based on the previous step's outcome:
- Success (default) — only run if the previous step succeeded
- Failure — only run if the previous step failed (use for cleanup or alert steps)
- Always — run regardless of previous step's outcome
- On Failure — what to do if this step fails:
- Stop (default) — abort the pipeline immediately; remaining steps render as
pendingin run history - Continue — record the failure but proceed to the next step
- Stop (default) — abort the pipeline immediately; remaining steps render as
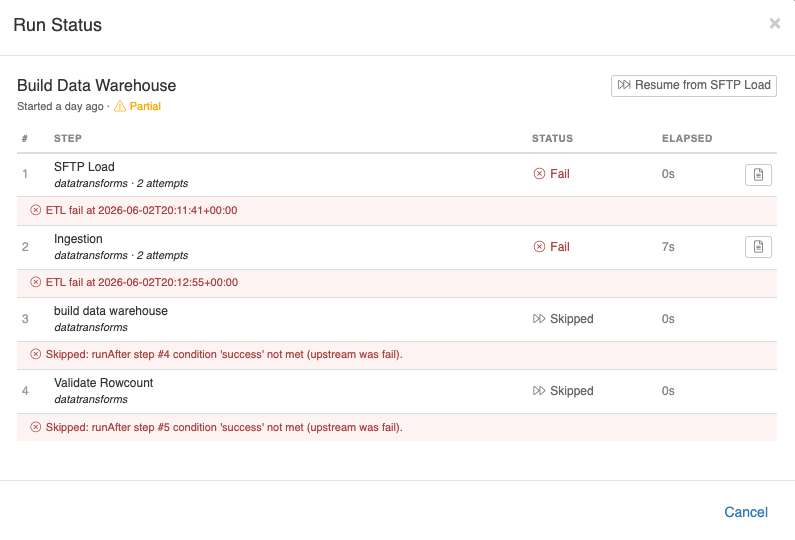
A pipeline whose final state is mixed — some steps succeeded, some failed or were skipped — is recorded as Partial. A pipeline where every attempted step succeeded is Success. A pipeline where every attempted step failed (or the first step failed with Stop) is Fail.
Parameters
Parameters are the connective tissue of a pipeline. A parameter is a named value that can be substituted into SQL via the [[@name]] placeholder syntax, passed as a dbt variable, or read by a downstream step as input.
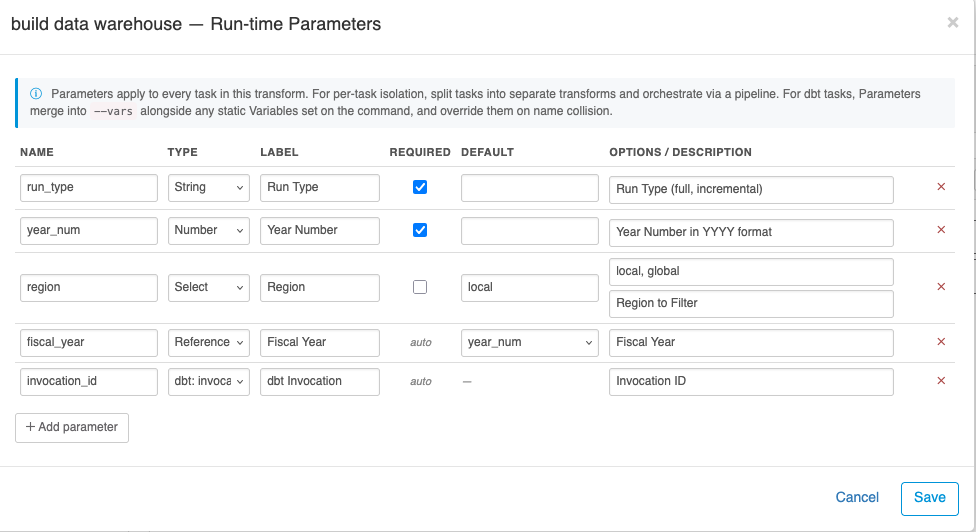
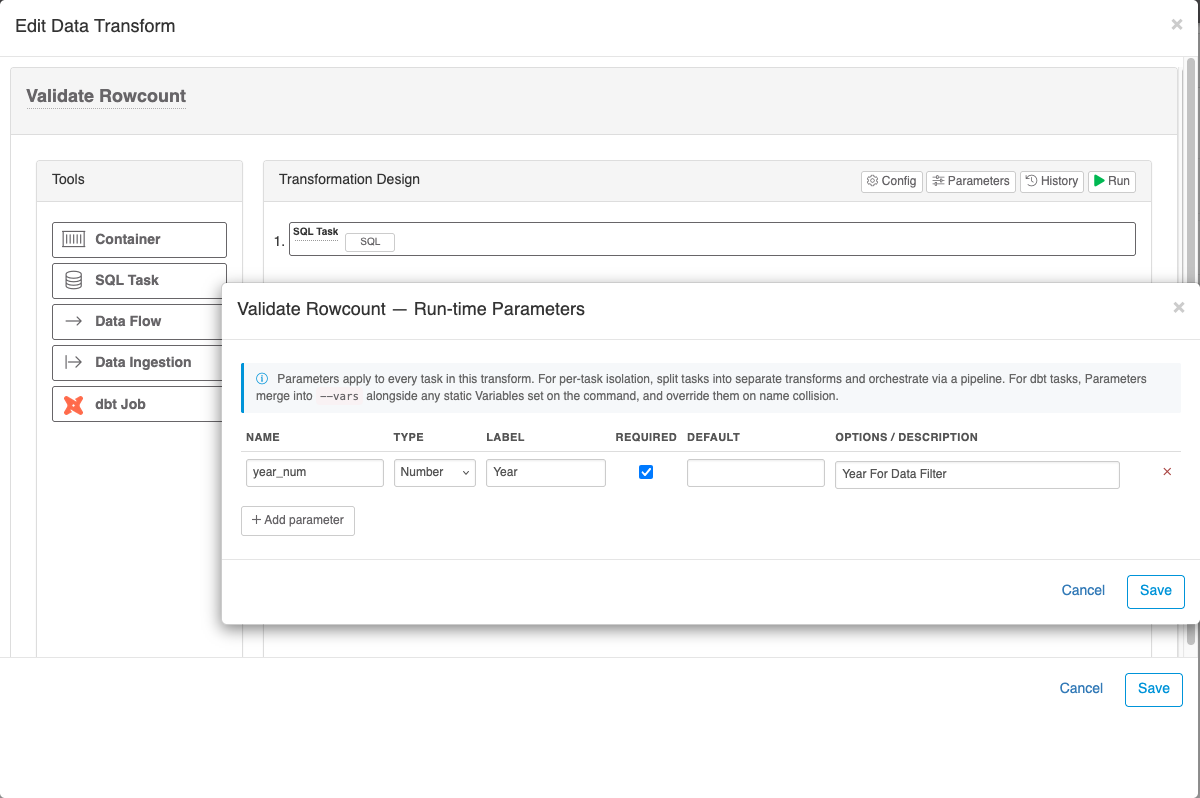
Declaring Parameters on a Transform
Open a Data Transform and click the Parameters button. Each parameter has a name, a type, and a source:
| Source | Behavior |
|---|---|
| User | Value supplied at run time, typically from the schedule modal at schedule-create time. |
| dbt-source | Auto-filled from the last upstream dbt step's command_invocation_id or equivalent identifier. Common for analyses that filter by "results from this run." |
| Ref | Value copied from another declared parameter by name. Useful for aliasing or renaming. |
| Template | Computed from other parameter values using filters (lower, upper, underscores, dashes, trim). Example: {{ region_code | lower }}. |
| Bool | A boolean value (true/false). Renders as a two-option select in the Set Parameters modal. |
The supported parameter types are string, number, bool, date, select (with a fixed option list), ref, and template. Type-aware coercion preserves the value's type through the pipeline — a number parameter survives as 2257 (not "2257") when it lands in a dbt --vars block, and a bool parameter survives as true (not "true").
Parameter Propagation
Parameters declared on a transform are local to that transform's editor, but at runtime they share a single namespace within a pipeline run. The pipeline maintains an accumulator (sharedRuntimeParams) that:
- Starts with values supplied by the schedule or run-now form
- Receives each step's
emittedParamsas the step completes - Feeds the merged map into the next step as that step's input
This means if step 1 emits region_code=NA and step 2 also declares a region_code parameter with a different default, step 2 sees NA (the runtime value wins over the declared default). Last writer wins.
If you intend two transforms to have independently-scoped values, name the parameters differently (source_region_code vs dbt_region_code).
Placeholder Syntax
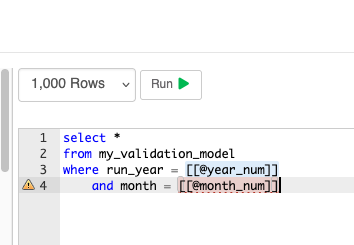
Use [[@name]] anywhere in a SQL string — Data Transform tasks, Analysis source SQL, dbt --vars. At run time, every [[@name]] is replaced with the resolved value from the pipeline's accumulator.
Type-aware substitution ensures [[@region_id]] becomes 42 (bare number) while [[@command_invocation_id]] becomes 'abc-123-def' (quoted string in this example), with the surrounding quotes coming from the SQL author's choice.
Important: pipeline-only. Placeholder substitution happens on the server when a pipeline (or the run-history "View results" replay) supplies a
runtimeParamspayload. There is no view-time prompt for ad-hoc readers. If a customer needs to choose a value at view time on a standalone report, use a BI Filter instead — filters are bound at the driver level and don't carry the same SQL-injection surface as text substitution.
Authoring with Placeholders
When editing a Data Transform's SQL task, the editor highlights every [[@name]] range:
- Blue background — the name matches a declared parameter
- Red dashed underline + gutter warning — the name does not match any declared parameter (typo, or you forgot to declare it)
An Insert Parameter dropdown above the SQL editor lists declared parameters and inserts the placeholder at the cursor (or replaces selected text). A New placeholder… item drops a [[@new_param]] template with the inner name preselected for renaming. The dropdown only appears in the transform task editor where a Parameters editor exists to declare against — Analyses and other contexts get the neutral blue highlight only.
Run Status and Drill-Through
Every pipeline run writes a PipelineRun row and one PipelineStepRun row per step. The Run Status modal opens automatically when you trigger a manual run and is reachable later from the Run History tab.
For each step, the modal shows:
- Status icon (success, fail, skipped, disabled, pending)
- Elapsed time
- A Log button (for Data Transform and dbt steps) that opens the underlying ETL history with full per-task details
- A View (eye) button on Analysis steps that opens the analysis pre-populated with the exact parameter values that were active at the time that step ran
The View button is the canonical way to drill into "what did this pipeline produce?" Open the run, click the eye on the Analysis step, and you see the analysis filtered to that run's outputs — [[@command_invocation_id]], [[@region_id]], and every other propagated value substitutes from the recorded runtimeParams on that step run, not the analysis's defaults.
If a step shows pending, it means the runner never reached it — usually because an earlier step failed with On Failure: Stop. Pending steps have no PipelineStepRun row.
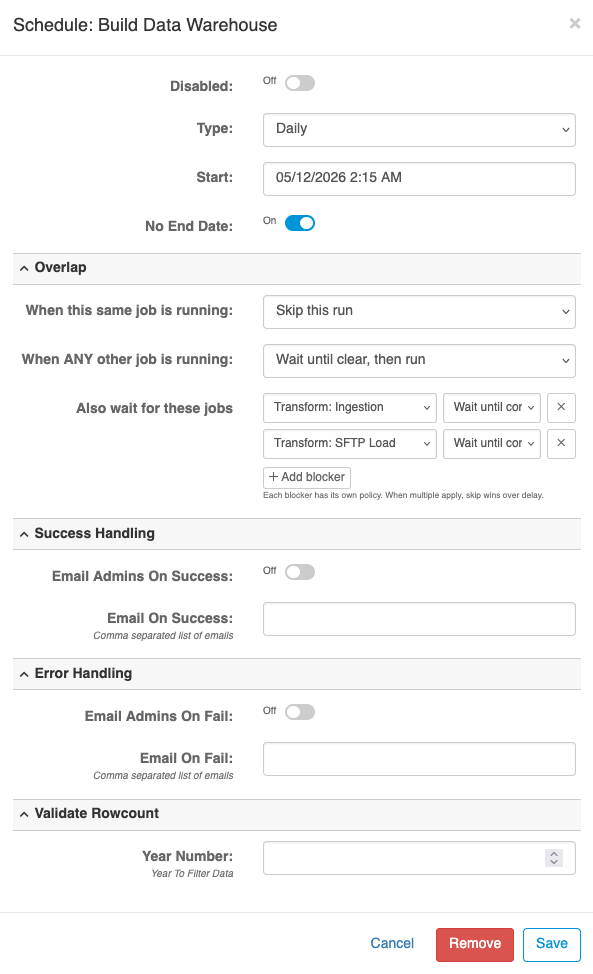
Scheduling
Schedule modal options mirror Data Transform scheduling:
- Daily / Weekly / Monthly / Cron Format
- Start, End, No End Date
- Disabled toggle
Pipelines also expose overlap protection (admin-only). These options prevent a new run from starting on top of work that's still in progress:
- Self Policy — what to do if a previous run of this same pipeline is still running:
- Skip — drop the new run; record it as skipped with reason
- Wait — queue the new run; start it when the current one finishes
- Run Anyway (default) — start in parallel
- Any Running Policy — what to do if any other job at all is currently running (use sparingly — this is a hard serialization):
- Skip / Wait / Run Anyway
- Blocked By — wait for a specific list of named Data Transforms or Pipelines to finish before starting
Strongest-action-wins: if your Self Policy says Run Anyway but Blocked By matches a currently-running job, the run waits. Default for deploy-type schedules is Wait; everything else defaults to Run Anyway so existing schedules don't change behavior unless you opt in.
Manual Triggers
Click the Run action on a pipeline in the Pipelines tab (or from inside the design view) to execute immediately. The Run Status modal opens and updates live. Closing the modal does not stop the pipeline — the runner continues server-side, and you can reopen the modal from the Run History tab.
Pipelines can also be triggered from the flexit CLI (see Background and external job triggers — same mechanism, just point runJob at the pipeline id).
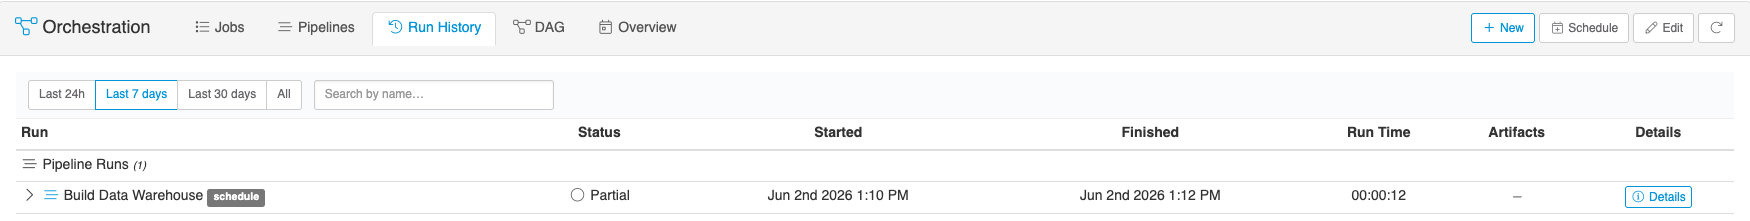
History and Logs
The Run History tab shows every run (manual + scheduled) for jobs and pipelines across the system, with status, start time, duration, and the user or schedule that triggered it. Drill into a row to see the Run Status modal as it appeared at completion. Filter and sort to focus on a specific pipeline or time range.
Step-level logs for Data Transform and dbt steps continue to live in the underlying ETL history (EtlHistory row). The Log button on each step deep-links to that history row, so any task-level retry counts, row counts, or error messages remain accessible exactly as they would be from the Data Transform's own history view.
Common Patterns
- Run analysis with the values from this run — make the analysis the last pipeline step. Author its SQL with
[[@command_invocation_id]]or whatever propagated value names the upstream emits. The View button on that step replays the exact values automatically. - Snapshot schema name per run — declare a parameter
snapshot_schemaof type template with valuesnap_{{ command_invocation_id | underscores }}. Reference[[@snapshot_schema]]in dbt model SQL or downstream loads. Each run gets a uniquely-named schema. - Conditional cleanup — add a final step with When: Failure that runs a cleanup transform or sends an alert. Set its On Failure: Continue so a cleanup-failure doesn't mask the original failure.
- Soft-disable a step during development — toggle Disabled on a slow data load step while iterating on a downstream analysis. The pipeline still runs to completion and propagates the disabled step's last-known parameter values from the previous successful run if they're stored elsewhere.
Views
The DAG and Overview tabs are alternative lenses over the same job and pipeline data — read-only, focused on topology and timing rather than authoring.
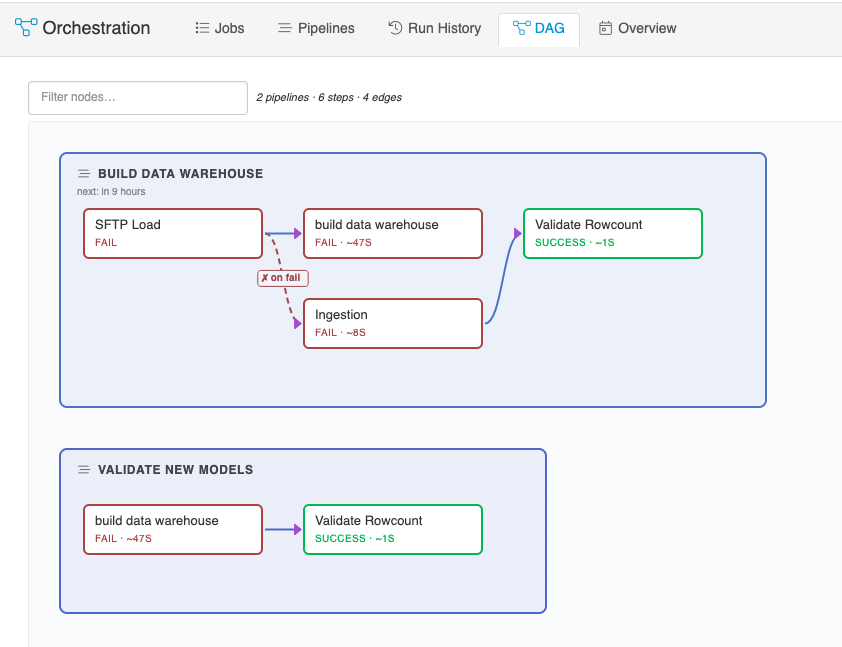
DAG
The DAG tab visualizes every job and pipeline as a node with edges connecting dependencies — pipeline step ownership and Blocked By schedule relationships. Search at the top filters nodes by name; click a node to focus on it and its neighbors. Use this when:
- Auditing the full dependency graph before adding a new pipeline or schedule.
- Tracing why a scheduled run waited (which upstream job did it block on?).
- Answering "who depends on what?" with a single-screen view rather than scanning the Jobs and Pipelines lists individually.
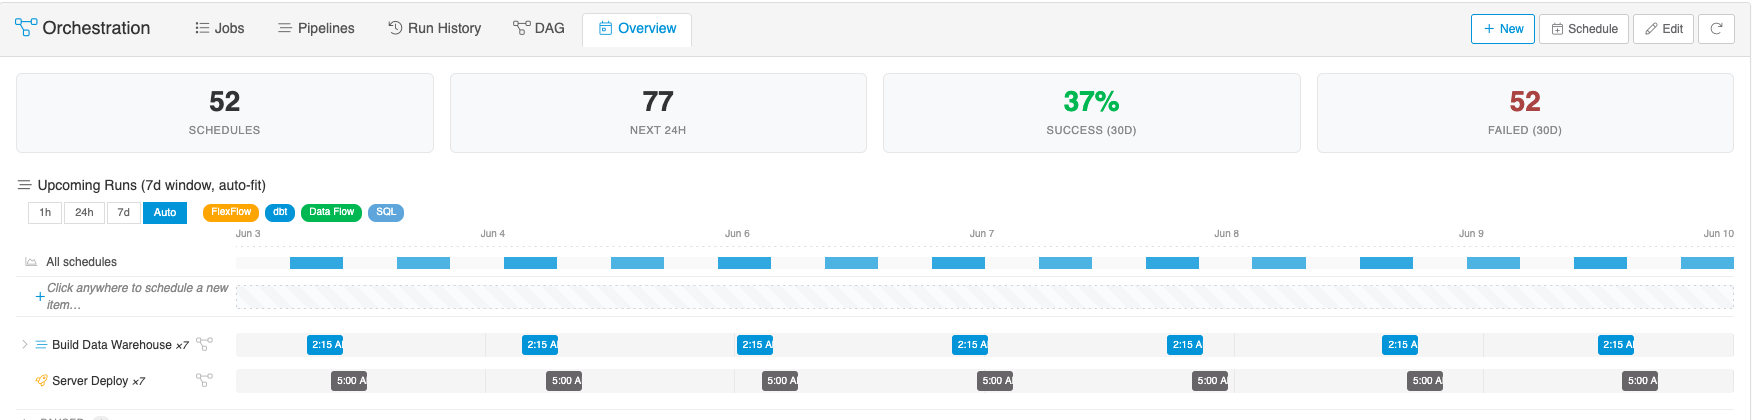
Overview
The Overview tab is a split view: a rolling timeline at the top of scheduled and upcoming runs over the next several hours, and a DAG panel at the bottom focused on whatever's selected in the timeline. Selecting a scheduled block highlights its dependencies below. In Edit mode (the pencil button in the toolbar), you can drag scheduled blocks to reschedule them in place. Use this when:
- Planning around a maintenance window — "what's running at 2am tonight?"
- Sanity-checking that a manual reschedule won't create overlap with another job.
- Reviewing the next few hours of activity at a glance.
Both views are derived from the same data the other tabs show; they don't introduce new state, just different ways of looking at it.
Permissions
Pipelines are admin-only by default. Consumers (read-only users) can view a pipeline's run results via the View button on a contentitem step when the pipeline run produced an analysis they have access to, but cannot create, edit, schedule, or trigger pipelines.